

 |
 |
 |
 |
 |
 |
 |
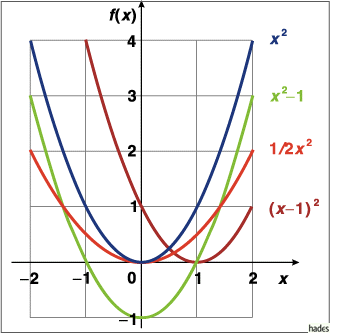
 nach unten verschobene Parabel.

Mathematica-Code:
Plot[{x^2,1/2(x^2),x^2-1,(x-1)^2},{x,-2,2}, PlotRange->{{-2.2,2.2},{-1.2,4.2}},
PlotStyle->{{Hue[0]},{Hue[0.3]},{Hue[0.6]},{Hue[0.8]}}, AspectRatio->Automatic]
 a bestimmt die Öffnung der Parabel.
 |
 |
 |
 |
 |
 |
 |
