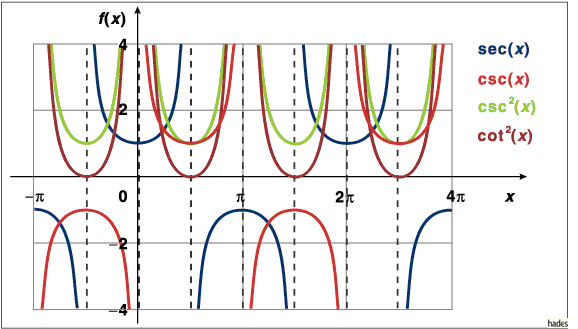
Sekans- und Cosekansfunktion - Grafische Darstellung
Die Funktionen lassen sich als Bögen beschreiben, die abwechselnd
im positiven und im negativen y-Bereich verlaufen. Die Funktionen
haben eine Periode von  und nehmen alle Werte außerhalb
  an.
an.

Mathematica Code:
Plot[{Sec[x],Csc[x],(Csc[x])^2,(Cot[x])^2},{x,-Pi,3Pi},PlotRange->{{-Pi,3Pi},{-4,4}},
PlotStyle->{{Hue[0]},{Hue[0.3]},{Hue[0.6]},{Hue[0.8]}},AspectRatio->Automatic]


